Edit chart
Loading graph
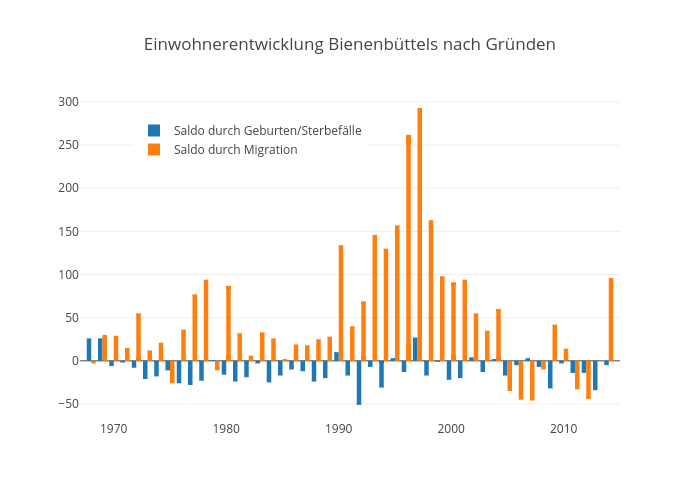
Kalapuskin's interactive graph and data of "Einwohnerentwicklung Bienenbüttels nach Gründen" is a bar chart, showing Saldo durch Geburten/Sterbefälle vs Saldo durch Migration. The x-axis shows values from 1967 to 2015. The y-axis shows values from -68.58737706863715 to 302.3384713099037.