Edit chart
Loading graph
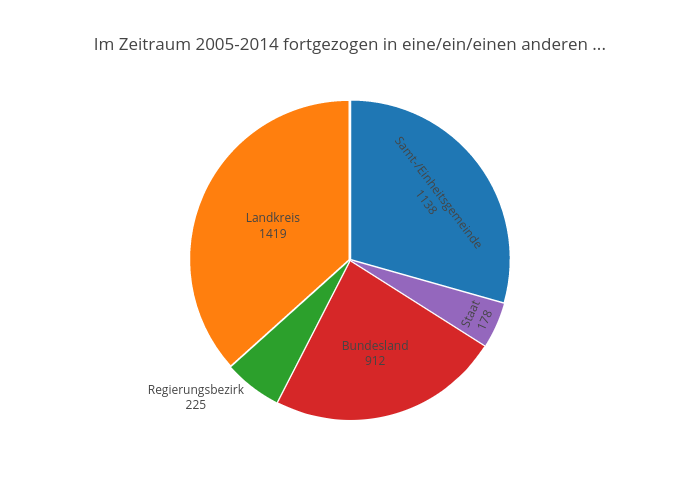
Kalapuskin's interactive graph and data of "Im Zeitraum 2005-2014 fortgezogen in eine/ein/einen anderen ..." is a pie, showing Fortzug. The x-axis shows values from 0 to 0. The y-axis shows values from 0 to 0.