1990
1995
2000
2005
2010
2015
2020
0
500
1000
1500
2000
2500
3000
Whg_NWG
Whg_3+W
Whg_2W
Whg_1W
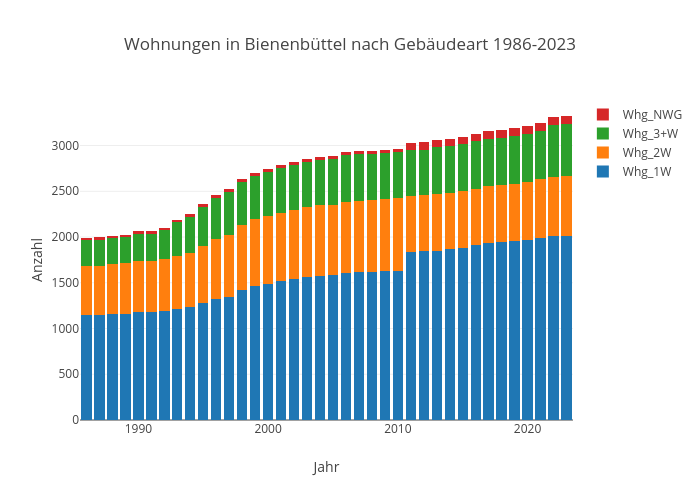
Wohnungen in Bienenbüttel nach Gebäudeart 1986-2023
Jahr
Anzahl
Edit chart
Kalapuskin's interactive graph and data of "Wohnungen in Bienenbüttel nach Gebäudeart 1986-2023" is a stacked bar chart, showing Whg_1W, Whg_2W, Whg_3+W, Whg_NWG; with Jahr in the x-axis and Anzahl in the y-axis.. The x-axis shows values from 1985.5 to 2023.5. The y-axis shows values from 0 to 3497.8947368421054.