Edit chart
Loading graph
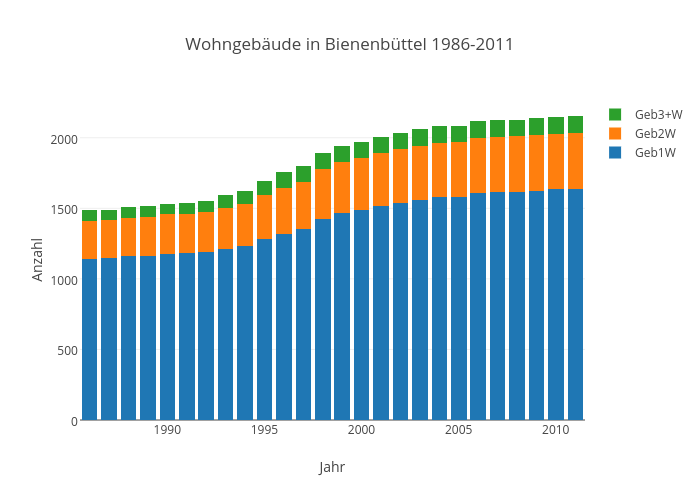
Kalapuskin's interactive graph and data of "Wohngebäude in Bienenbüttel 1986-2011" is a stacked bar chart, showing Geb1W, Geb2W, Geb3+W; with Jahr in the x-axis and Anzahl in the y-axis.. The x-axis shows values from 1985.5 to 2011.5. The y-axis shows values from 0 to 2267.3684210526317.