Edit chart
Loading graph
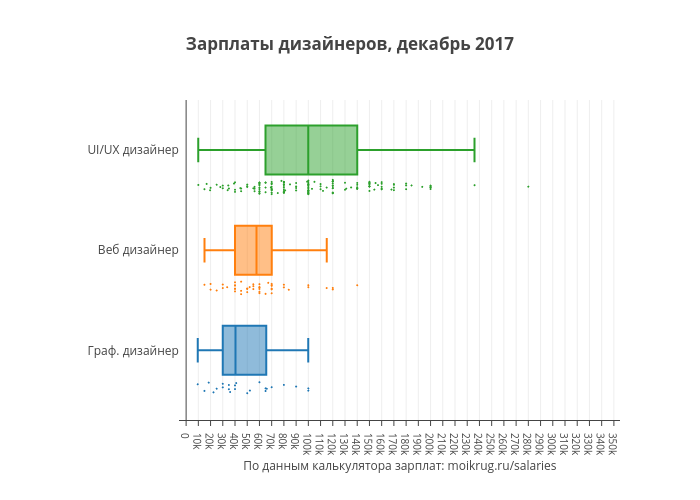
Karaboz's interactive graph and data of "Зарплаты дизайнеров, декабрь 2017" is a box plot, showing Граф. дизайнер, Веб дизайнер, UI/UX дизайнер; with По данным калькулятора зарплат: moikrug.ru/salaries in the x-axis and in the y-axis.. The x-axis shows values from -5000 to 355000. The y-axis shows values from -0.696 to 2.5.