Edit chart
Loading graph
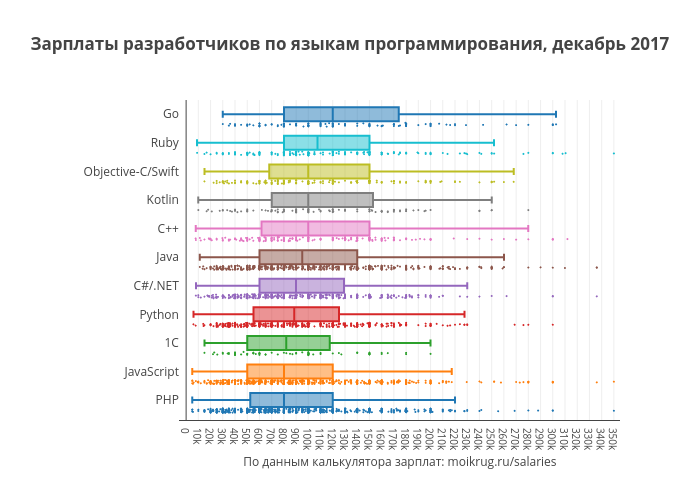
Karaboz's interactive graph and data of "Зарплаты разработчиков по языкам программирования, декабрь 2017" is a box plot, showing PHP, JavaScript, 1С, Python, C#/.NET, Java, C++, Kotlin, Objective-C/Swift, Ruby, Go; with По данным калькулятора зарплат: moikrug.ru/salaries in the x-axis and in the y-axis.. The x-axis shows values from -5000 to 355000. The y-axis shows values from -0.696 to 10.5.