Edit chart
Loading graph
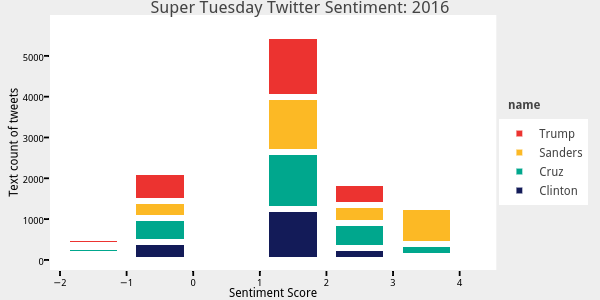
Keberwein77's interactive graph and data of "Super Tuesday Twitter Sentiment: 2016" is a stacked bar chart, showing Clinton, Cruz, Sanders, Trump; with Sentiment Score in the x-axis and Text count of tweets in the y-axis.. The x-axis shows values from -2 to 4.4. The y-axis shows values from -2 to 5756.1. This visualization has the following annotation: name