Edit chart
Loading graph
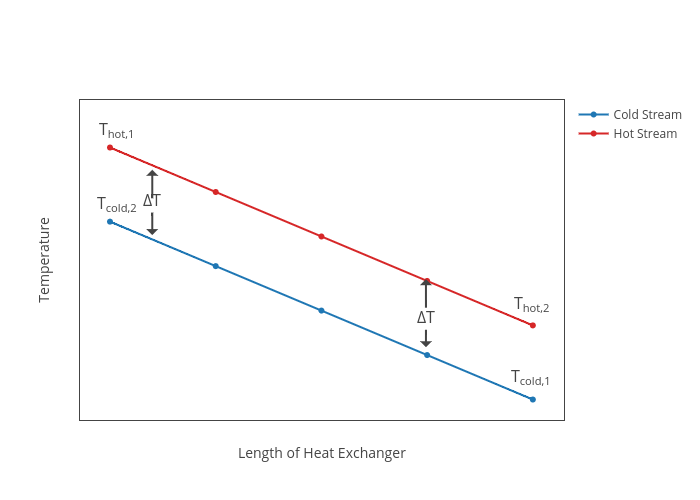
Kentang2774's interactive graph and data of "Temperature vs Length of Heat Exchanger" is a line chart, showing Cold Stream vs Hot Stream; with Length of Heat Exchanger in the x-axis and Temperature in the y-axis.. The x-axis shows values from 0.21627719972779347 to 4.794622697505758. The y-axis shows values from 16.193976689721026 to 232.05834003764102. This visualization has the following annotations: Thot,1; Thot,2; Tcold,1; Tcold,2; ΔT; ΔT