Edit chart
Loading graph
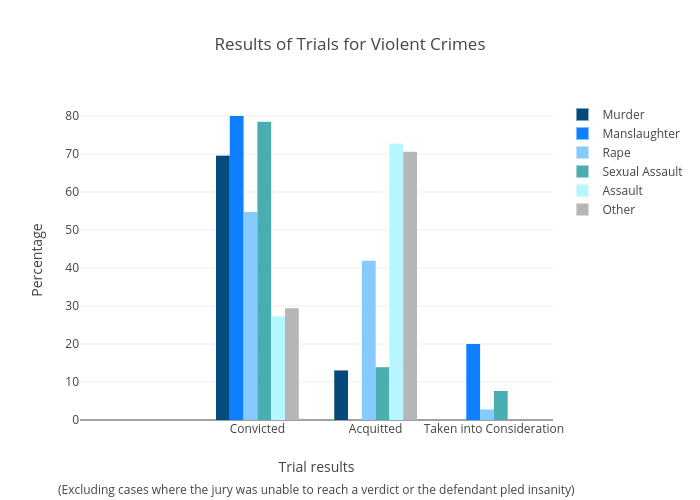
Kirbreton's interactive graph and data of "Results of Trials for Violent Crimes" is a bar chart, showing Murder, Manslaughter, Rape, Sexual Assault, Assault, Other; with Trial results in the x-axis and Percentage in the y-axis.. The x-axis shows values from -0.5 to 3.5. The y-axis shows values from 0 to 84.21052631578948. This visualization has the following annotation: (Excluding cases where the jury was unable to reach a verdict or the defendant pled insanity)