Edit chart
Loading graph
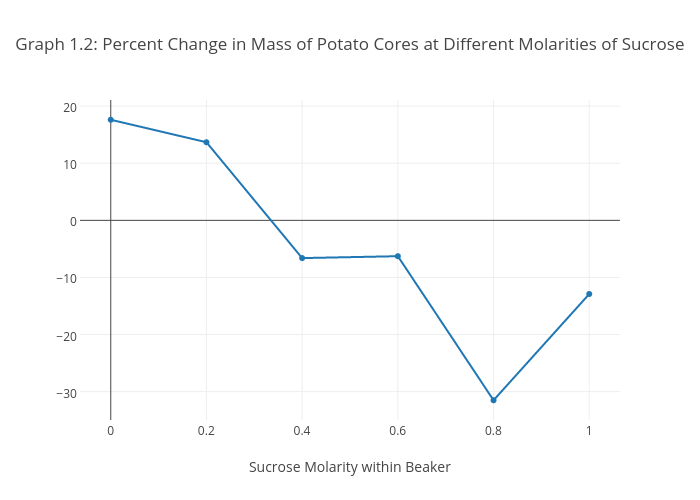
Kiwishea's interactive graph and data of "Graph 1.2: Percent Change in Mass of Potato Cores at Different Molarities of Sucrose " is a scatter chart, showing Col2; with Sucrose Molarity within Beaker in the x-axis. The x-axis shows values from -0.06273698724577731 to 1.0627369872457773. The y-axis shows values from -34.79601957585645 to 20.906019575856444.