Edit chart
Loading graph
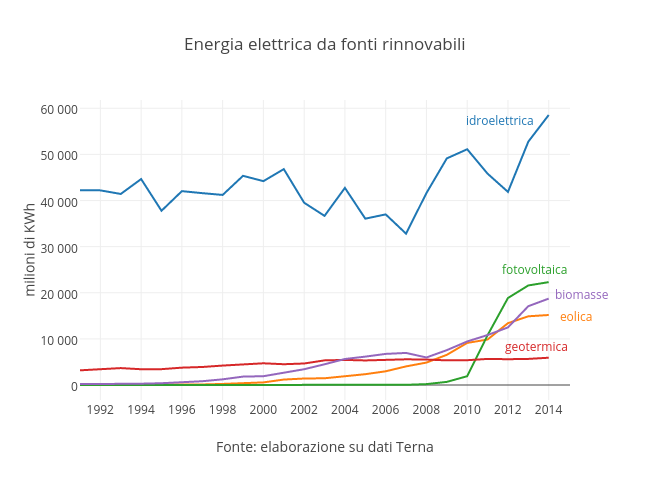
Kode's interactive graph and data of "Energia elettrica da fonti rinnovabili" is a scatter chart, showing idroelettrica, eolica, fotovoltaica, geotermica, biomasse e rifiuti; with Fonte: elaborazione su dati Terna in the x-axis and milioni di KWh in the y-axis.. The x-axis shows values from 1991 to 2015.12397223657. The y-axis shows values from -3252.4166666666665 to 61797.91666666667. This visualization has the following annotations: idroelettrica; fotovoltaica; biomasse; geotermica; eolica