0
100
200
300
400
500
−3
−2
−1
0
1
2
3
−2
−1
0
1
2
plotly-logomark
Edit chart
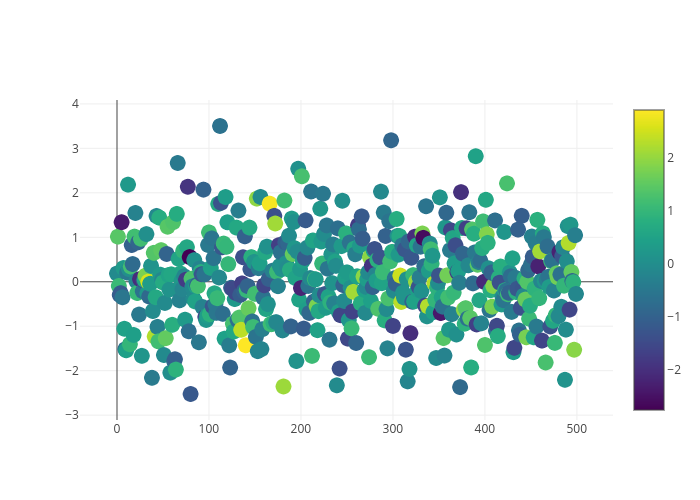
Kohei_kimura's interactive graph and data is a scatter chart. The x-axis shows values from -36.662153939762696 to 535.6621539397627. The y-axis shows values from -3.0931291702148638 to 4.071914462292881.