Edit chart
Loading graph
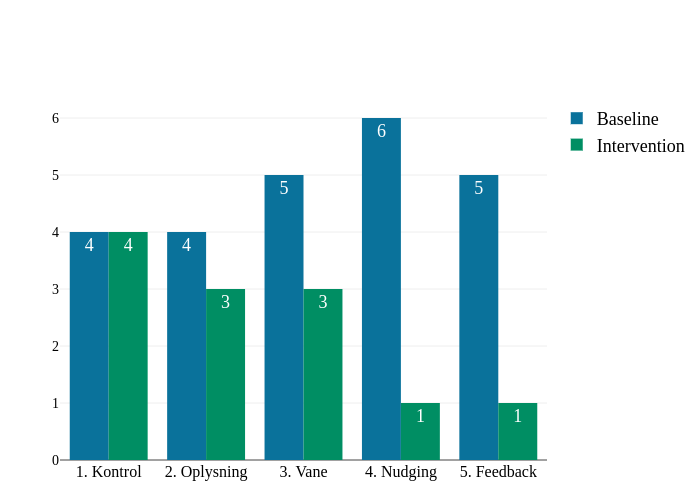
Kristian_kl7's interactive graph and data of "Deltagere, der lufter ud 0 gange/uge" is a bar chart, showing Baseline vs Intervention; with Antal deltagere in the y-axis. The x-axis shows values from -0.5 to 4.5. The y-axis shows values from 0 to 6.315789473684211.