Edit chart
Loading graph
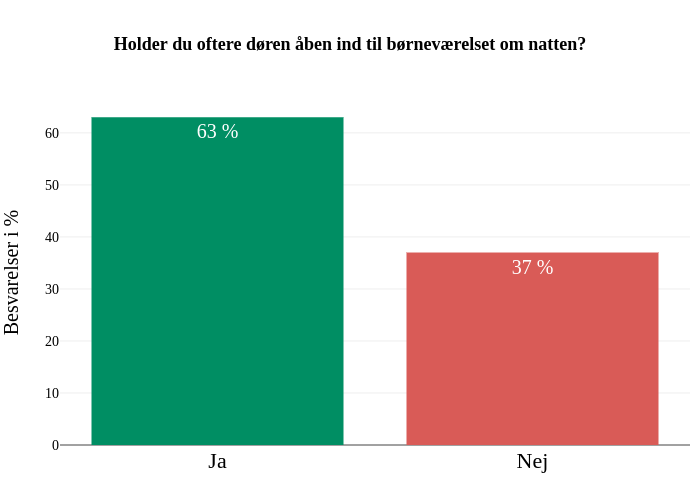
Kristian_kl7's interactive graph and data of "Holder du oftere døren åben ind til børneværelset om natten?" is a bar chart; with Besvarelser i % in the y-axis. The x-axis shows values from -0.5 to 1.5. The y-axis shows values from 0 to 66.3157894736842.