Edit chart
Loading graph
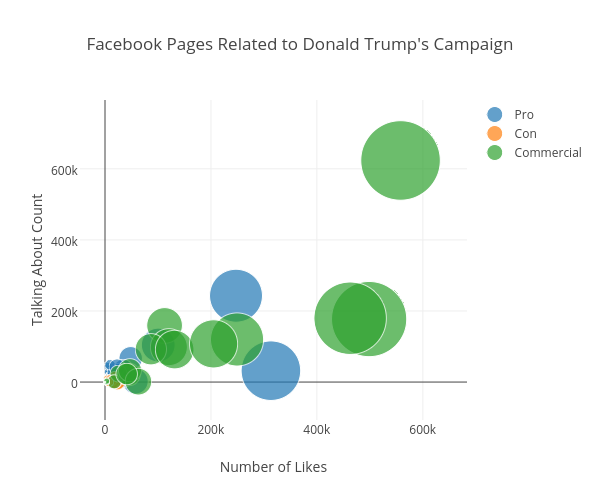
Kstohr's interactive graph and data of "Facebook Pages Related to Donald Trump's Campaign" is a scatter chart, showing Pro, Con, Commercial; with Number of Likes in the x-axis and Talking About Count in the y-axis.. The x-axis shows values from -41447.52741027481 to 676234.490834752. The y-axis shows values from -106773.18914644021 to 793555.3392588381.