Edit chart
Loading graph
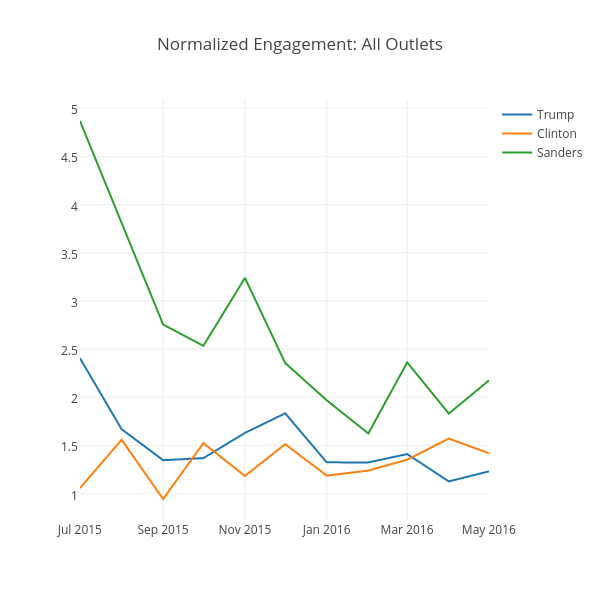
Kstohr's interactive graph and data of "Normalized Engagement: All Outlets" is a line chart, showing Trump, Clinton, Sanders; with time in the x-axis. The x-axis shows values from 1435734000000 to 1462086000000. The y-axis shows values from 0.7259155047665987 to 5.084441486534408.