Edit chart
Loading graph
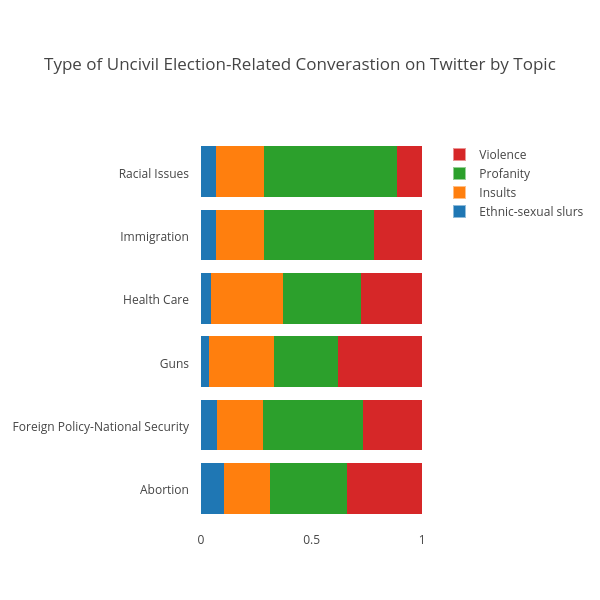
Kstohr's interactive graph and data of "Type of Uncivil Election-Related Converastion on Twitter by Topic" is a stacked bar chart, showing Ethnic-sexual slurs, Insults, Profanity, Violence. The x-axis shows values from 0 to 1.0526422051344555. The y-axis shows values from -0.5 to 5.5.