Edit chart
Loading graph
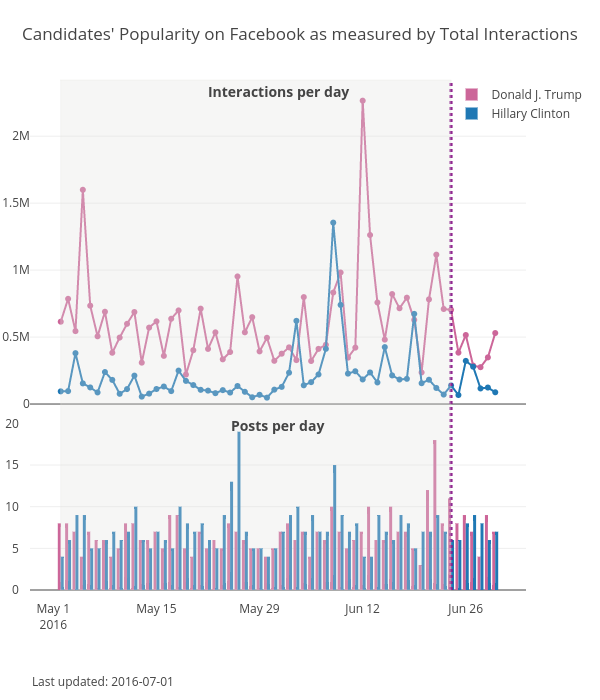
Kstohr's interactive graph and data of "Candidates' Popularity on Facebook as measured by Total Interactions" is a line chart, showing Donald J. Trump, Hillary Clinton, Donald J. Trump, Hillary Clinton. The x-axis shows values from 0 to 0. The y-axis shows values from 0 to 0. This visualization has the following annotations: Interactions per day; Posts per day; Last updated: 2016-07-01