Edit chart
Loading graph
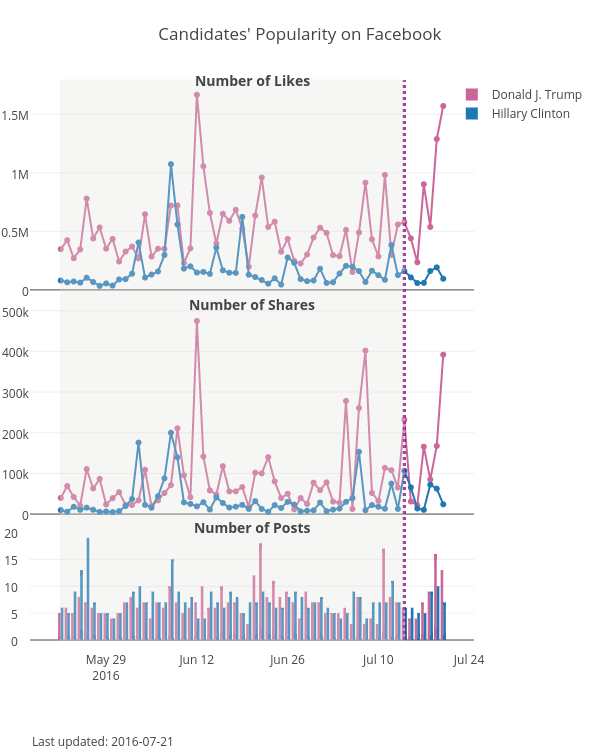
Kstohr's interactive graph and data of "Candidates' Popularity on Facebook" is a line chart, showing Donald J. Trump, Hillary Clinton, Donald J. Trump, Hillary Clinton, Donald J. Trump, Hillary Clinton; with time in the x-axis. The x-axis shows values from 1463490592941.1765 to 1469407807058.8235. The y-axis shows values from -91810.54251711364 to 1792951.5425171137. This visualization has the following annotations: Number of Likes; Number of Shares; Number of Posts; Last updated: 2016-07-21