Edit chart
Loading graph
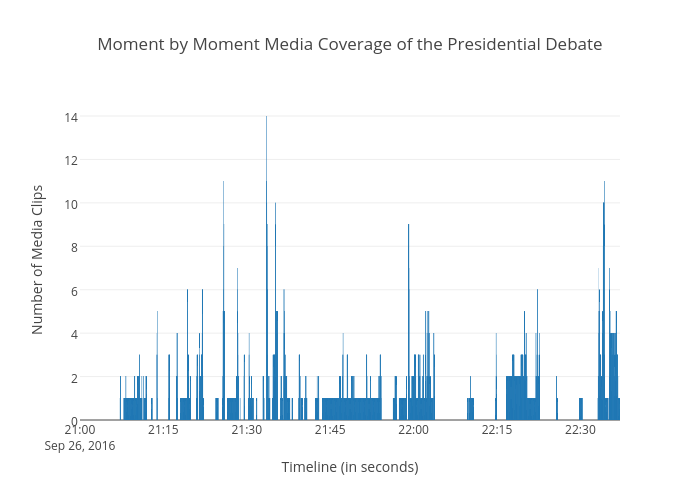
Kstohr's interactive graph and data of "Moment by Moment Media Coverage of the Presidential Debate" is a bar chart; with Timeline (in seconds) in the x-axis and Number of Media Clips in the y-axis.. The x-axis shows values from 0 to 0. The y-axis shows values from 0 to 0.