Edit chart
Loading graph
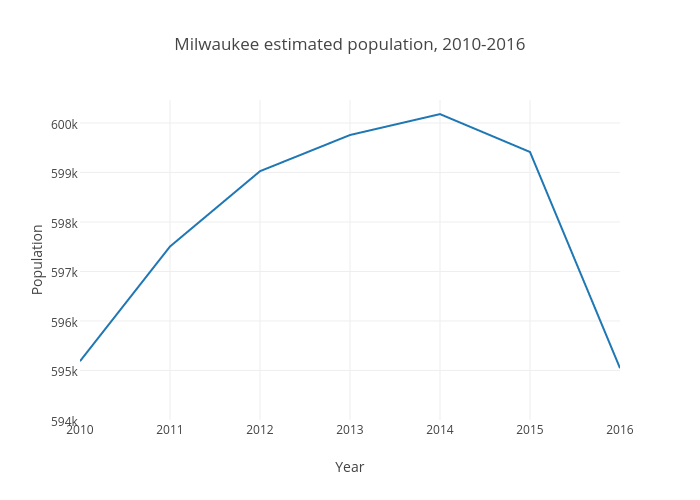
Kustjt's interactive graph and data of "Milwaukee estimated population, 2010-2016" is a line chart, showing B; with Year in the x-axis and Population in the y-axis.. The x-axis shows values from 2010 to 2016. The y-axis shows values from 594000 to 600463.0555555555.