Edit chart
Loading graph
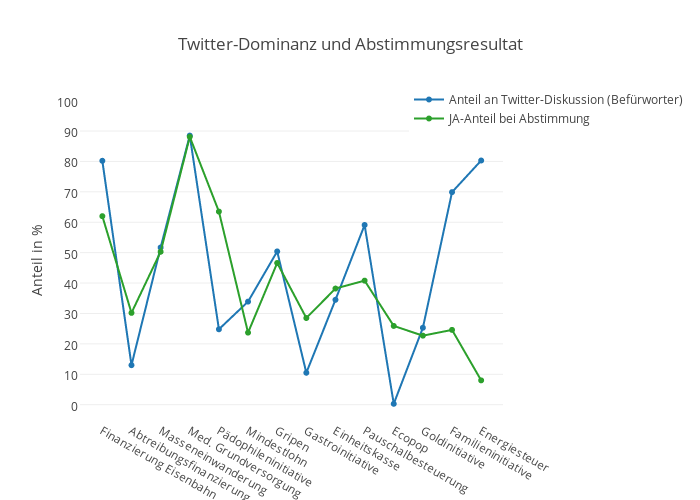
L_lauener's interactive graph and data of "Twitter-Dominanz und Abstimmungsresultat" is a scatter chart, showing Anteil an Twitter-Diskussion (Befürworter) vs JA-Anteil bei Abstimmung ; with Anteil in % in the y-axis. The x-axis shows values from -0.7667371546991819 to 13.748983311237485. The y-axis shows values from -5.033333545835804 to 100.1989557824852.