Edit chart
Loading graph
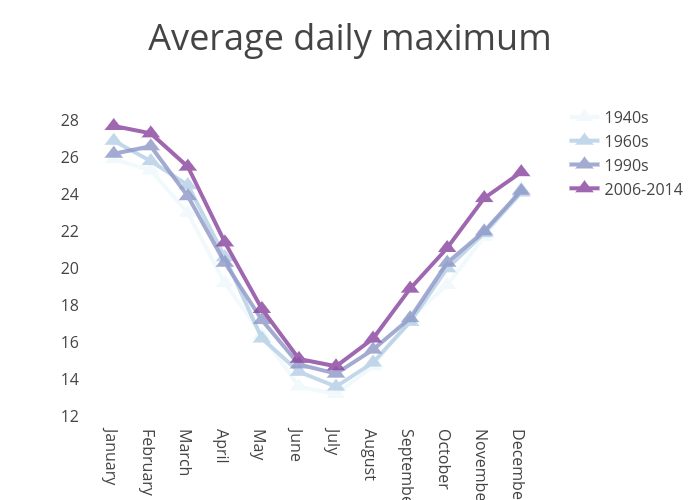
Lazappi's interactive graph and data of "Average daily maximum" is a scatter chart, showing 1940s, 1960s, 1990s, 2006-2014. The x-axis shows values from -0.7152718595534344 to 11.715271859553434. The y-axis shows values from 12.099423182567294 to 28.800576817432706.