Edit chart
Loading graph
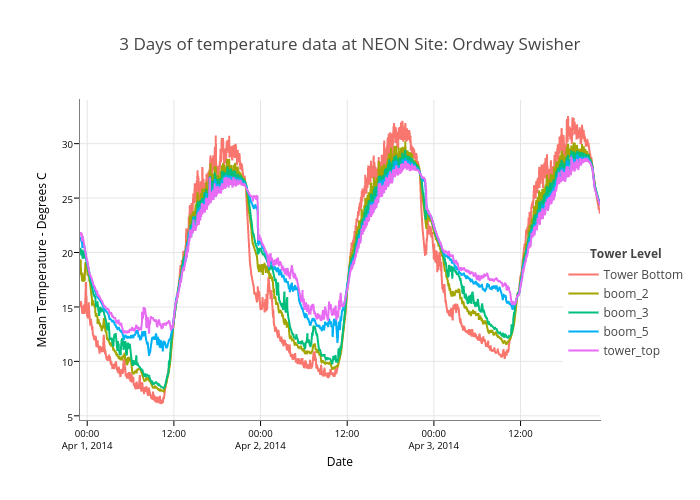
Leahawasser's interactive graph and data of "3 Days of temperature data at NEON Site: Ordway Swisher" is a line chart, showing Tower Bottom, boom_2, boom_3, boom_5, tower_top; with Date in the x-axis and Mean Temperature - Degrees C in the y-axis.. The x-axis shows values from 1396328400000 to 1396587600000. The y-axis shows values from 4.6149573315556385 to 34.00966951167037. This visualization has the following annotation: Tower Level