Edit chart
Loading graph
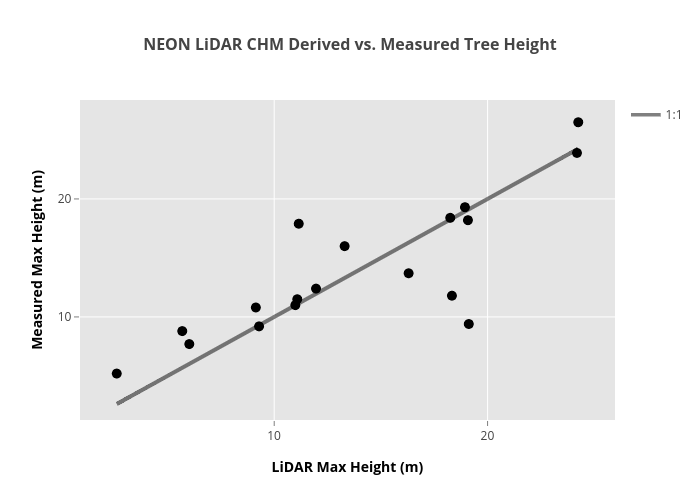
Leahawasser's interactive graph and data of "NEON LiDAR CHM Derived vs. Measured Tree Height" is a scatter chart, showing None vs 1:1; with LiDAR Max Height (m) in the x-axis and Measured Max Height (m) in the y-axis.. The x-axis shows values from 0.8741417072630475 to 25.995853409924454. The y-axis shows values from 1.2648979774290672 to 28.36684077259772.