Edit chart
Loading graph
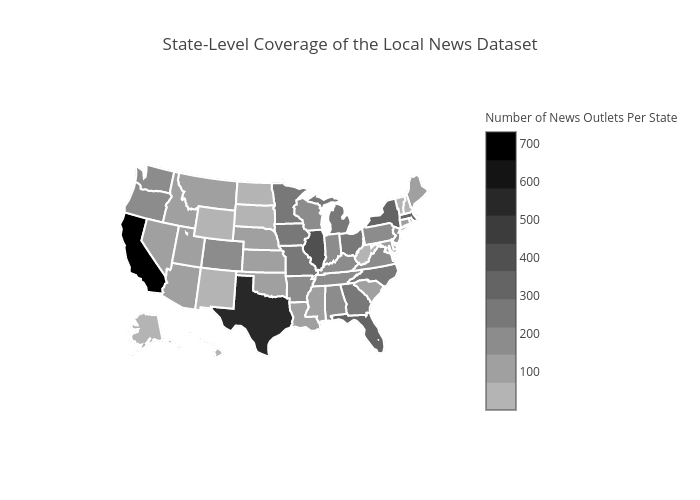
Leonyin's interactive graph and data of "State-Level Coverage of the Local News Dataset" is a choropleth. The x-axis shows values from 0 to 0. The y-axis shows values from 0 to 0.