Edit chart
Loading graph
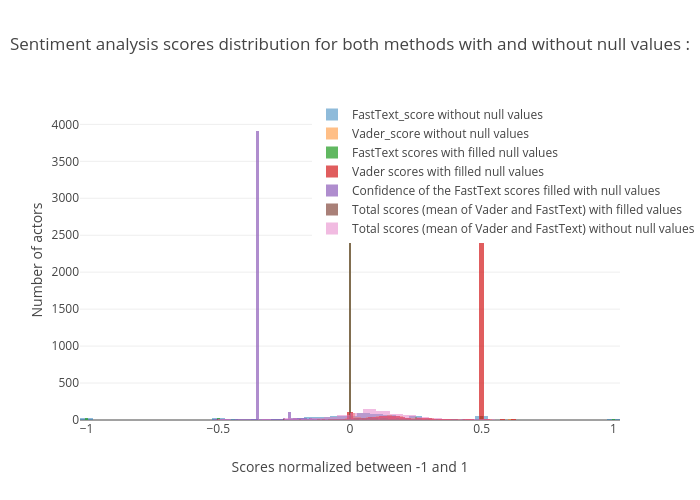
Lesimplen's interactive graph and data of "Sentiment analysis scores distribution for both methods with and without null values : " is a histogram, showing FastText_score without null values, Vader_score without null values, FastText scores with filled null values, Vader scores with filled null values, Confidence of the FastText scores filled with null values, Total scores (mean of Vader and FastText) with filled values, Total scores (mean of Vader and FastText) without null values; with Scores normalized between -1 and 1 in the x-axis and Number of actors in the y-axis.. The x-axis shows values from -1.025 to 1.0250000000000006. The y-axis shows values from 0 to 4329.473684210527.