Edit chart
Loading graph
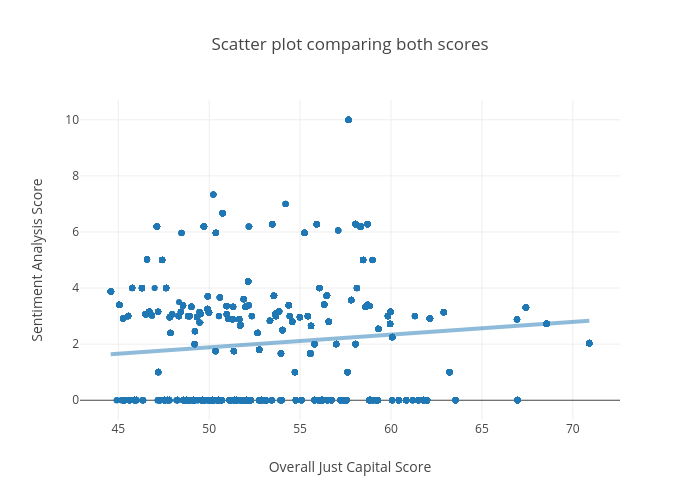
Lesimplen's interactive graph and data of "Scatter plot comparing both scores" is a scatter chart; with Overall Just Capital Score in the x-axis and Sentiment Analysis Score in the y-axis.. The x-axis shows values from 43.00921396852939 to 72.48212416467061. The y-axis shows values from -0.6537102473498233 to 10.653710247349823.