Edit chart
Loading graph
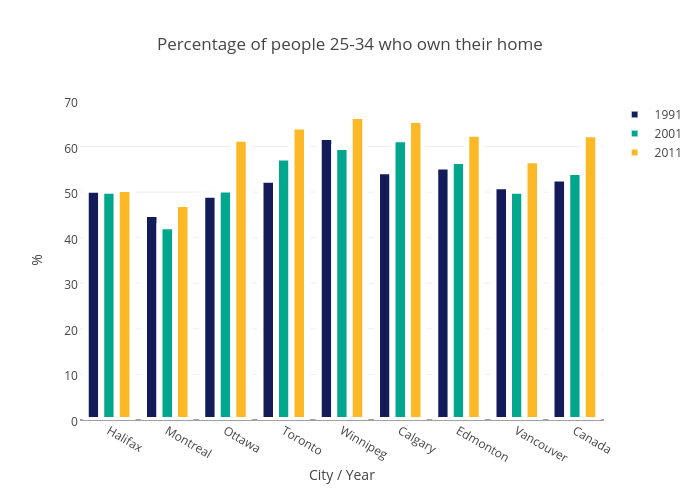
Leslieyoung's interactive graph and data of "Percentage of people 25-34 who own their home" is a grouped bar chart, showing 1991, 2001, 2011; with City / Year in the x-axis and % in the y-axis.. The x-axis shows values from -0.5 to 8.5. The y-axis shows values from 0 to 70.21052631578948.