Edit chart
Loading graph
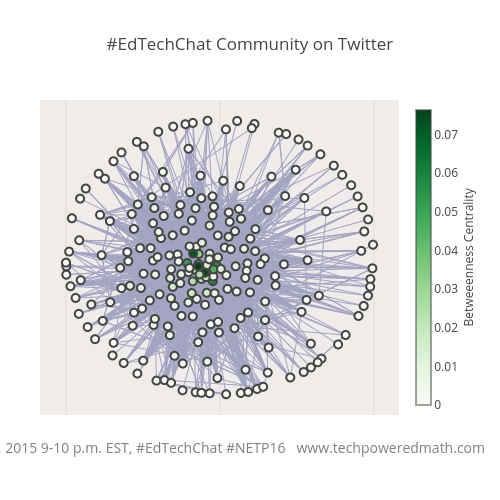
Lgallen's interactive graph and data of "#EdTechChat Community on Twitter" is a line chart; with Dec 14, 2015 9-10 p.m. EST, #EdTechChat #NETP16 www.techpoweredmath.com in the x-axis. The x-axis shows values from -0.07315277876189584 to 1.0704583477341176. The y-axis shows values from -0.07586837294332724 to 1.0758683729433272.