Edit chart
Loading graph
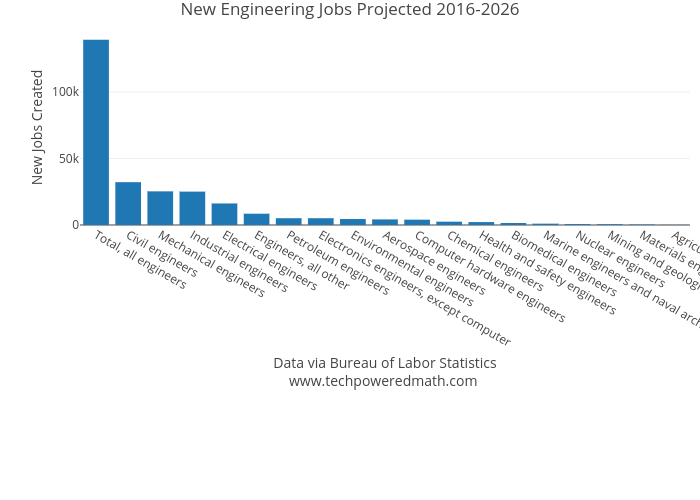
Lgallen's interactive graph and data of "New Engineering Jobs Projected 2016-2026" is a bar chart, showing New jobs, projected 2016â26; with Data via Bureau of Labor Statisticswww.techpoweredmath.com in the x-axis and New Jobs Created in the y-axis.. The x-axis shows values from -0.5 to 18.5. The y-axis shows values from 0 to 146631.57894736843.