Edit chart
Loading graph
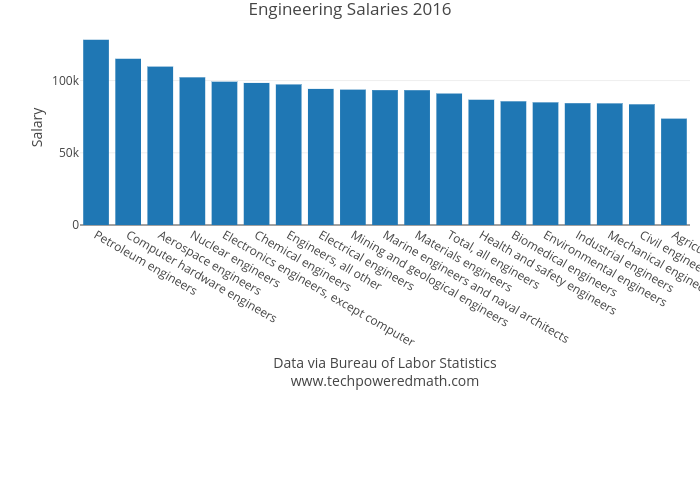
Lgallen's interactive graph and data of "Engineering Salaries 2016" is a bar chart, showing Median annual wage, 2016; with Data via Bureau of Labor Statisticswww.techpoweredmath.com in the x-axis and Salary in the y-axis.. The x-axis shows values from -0.5 to 18.5. The y-axis shows values from 0 to 134978.94736842104.