Edit chart
Loading graph
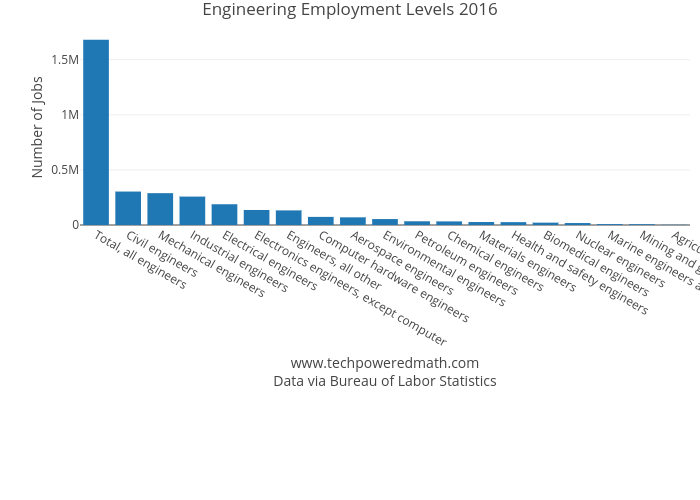
Lgallen's interactive graph and data of "Engineering Employment Levels 2016" is a bar chart, showing Employment, 2016; with www.techpoweredmath.comData via Bureau of Labor Statistics in the x-axis and Number of Jobs in the y-axis.. The x-axis shows values from -0.5 to 18.5. The y-axis shows values from 0 to 1769473.6842105263.