Edit chart
Loading graph
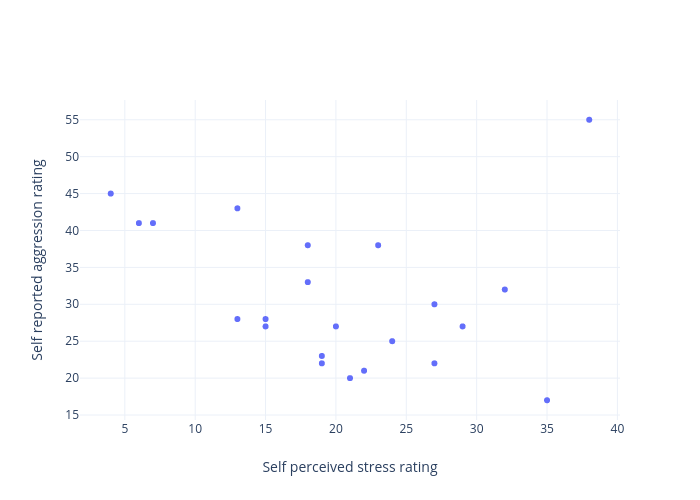
Lilkatiecoo's interactive graph and data of "Self reported aggression rating vs Self perceived stress rating" is a scatter chart; with Self perceived stress rating in the x-axis and Self reported aggression rating in the y-axis.. The x-axis shows values from 1.8691939890710376 to 40.130806010928964. The y-axis shows values from 13.158469945355192 to 58.84153005464481.