Edit chart
Loading graph
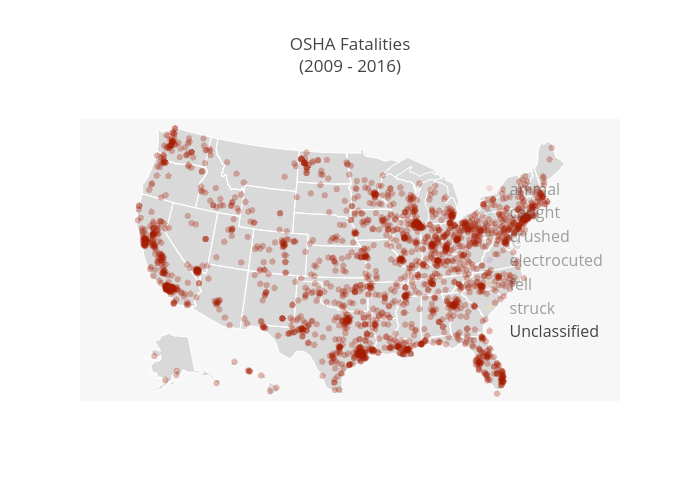
Llewellynjean's interactive graph and data of "OSHA Fatalities(2009 - 2016)" is a scattergeo, showing animal, caught, crushed, electrocuted, fell, struck, Unclassified. The x-axis shows values from 0 to 0. The y-axis shows values from 0 to 0.