Edit chart
Loading graph
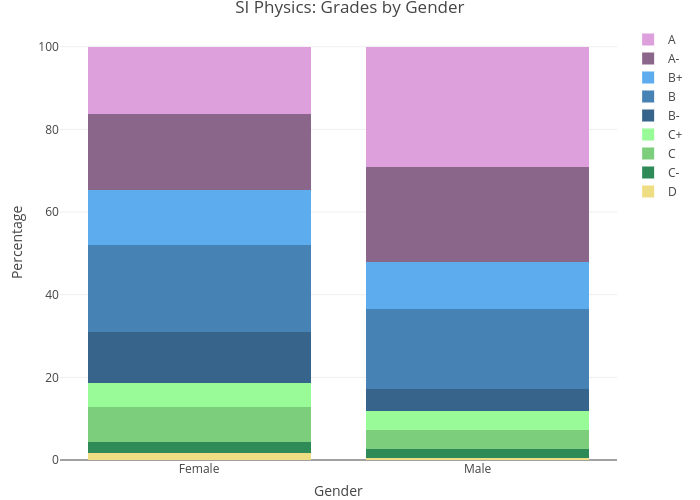
Lliu12's interactive graph and data of "SI Physics: Grades by Gender" is a stacked bar chart, showing D, C-, C, C+, B-, B, B+, A-, A; with Gender in the x-axis and Percentage in the y-axis.. The x-axis shows values from 0 to 0. The y-axis shows values from 0 to 0.