Edit chart
Loading graph
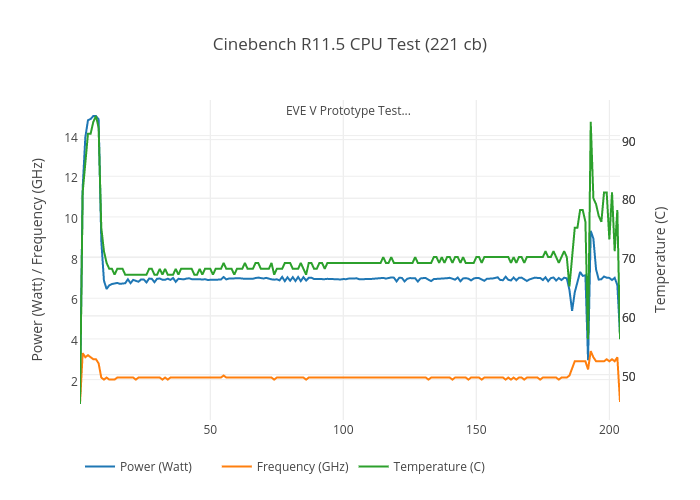
Lordfish's interactive graph and data of "Cinebench R11.5 CPU Test (221 cb)" is a line chart, showing Power (Watt), Frequency (GHz), Temperature (C); with Elapsed Time (sec) in the x-axis and Power (Watt) / Frequency (GHz) in the y-axis.. The x-axis shows values from 0.993 to 203.984. The y-axis shows values from 0.013222222222222246 to 15.748777777777777. This visualization has the following annotation: EVE V Prototype Test...