Edit chart
Loading graph
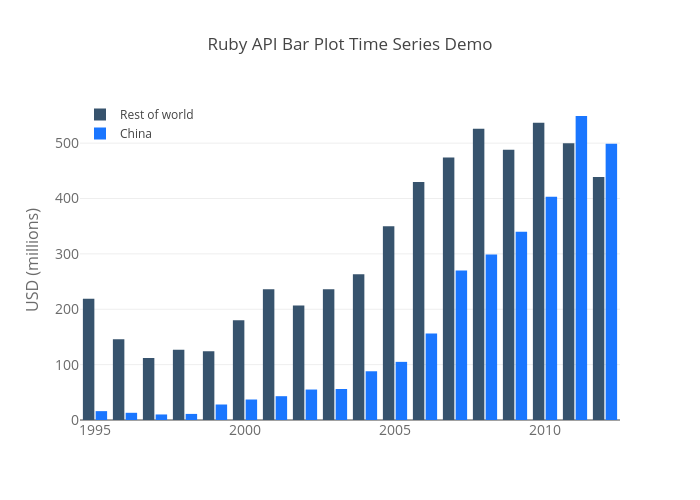
Louism's interactive graph and data of "Ruby API Bar Plot Time Series Demo" is a bar chart, showing Rest of world vs China; with USD (millions) in the y-axis. The x-axis shows values from 0 to 0. The y-axis shows values from 0 to 0.