Edit chart
Loading graph
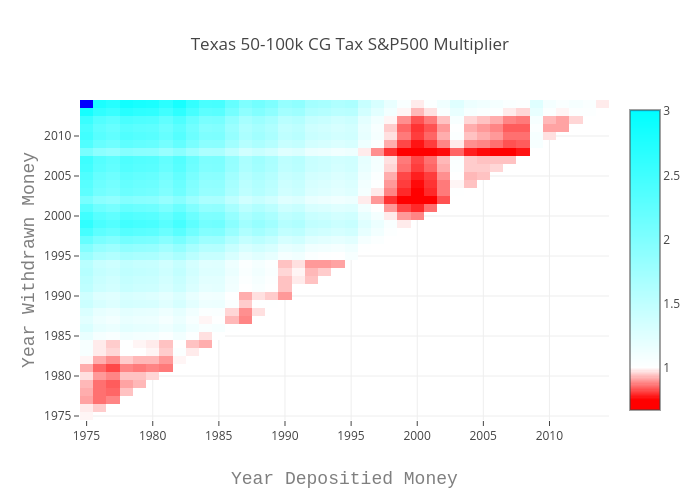
Louismillette's interactive graph and data of "Texas 50-100k CG Tax S&P500 Multiplier" is a heatmap; with Year Depositied Money in the x-axis and Year Withdrawn Money in the y-axis.. The x-axis shows values from 0 to 0. The y-axis shows values from 0 to 0.