Edit chart
Loading graph
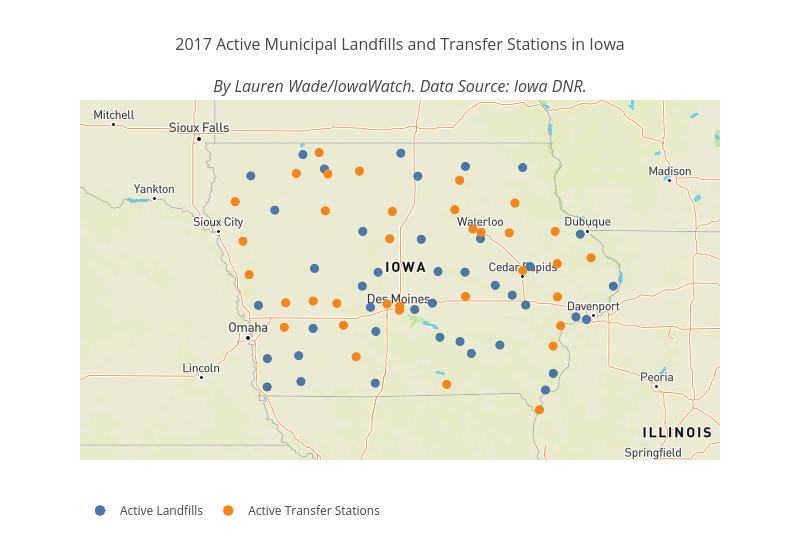
Lrmwade's interactive graph and data of "2017 Active Municipal Landfills and Transfer Stations in Iowa By Lauren Wade/IowaWatch. Data Source: Iowa DNR. " is a scattermapbox, showing Active Landfills vs Active Transfer Stations . The x-axis shows values from -1 to 6. The y-axis shows values from -1 to 4.