Edit chart
Loading graph
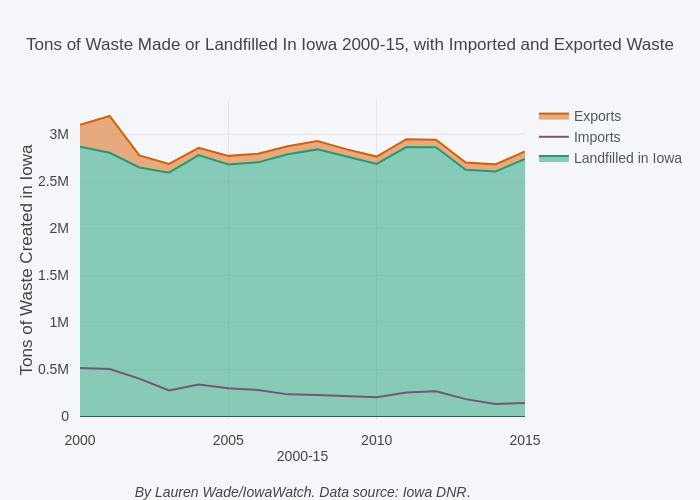
Lrmwade's interactive graph and data of "Tons of Waste Made or Landfilled In Iowa 2000-15, with Imported and Exported Waste" is a line chart, showing Landfilled in Iowa, Imports, Exports; with 2000-15 By Lauren Wade/IowaWatch. Data source: Iowa DNR. in the x-axis and Tons of Waste Created in Iowa in the y-axis.. The x-axis shows values from 2000 to 2015. The y-axis shows values from -37202.458888888825 to 3364084.518888889.