Edit chart
Loading graph
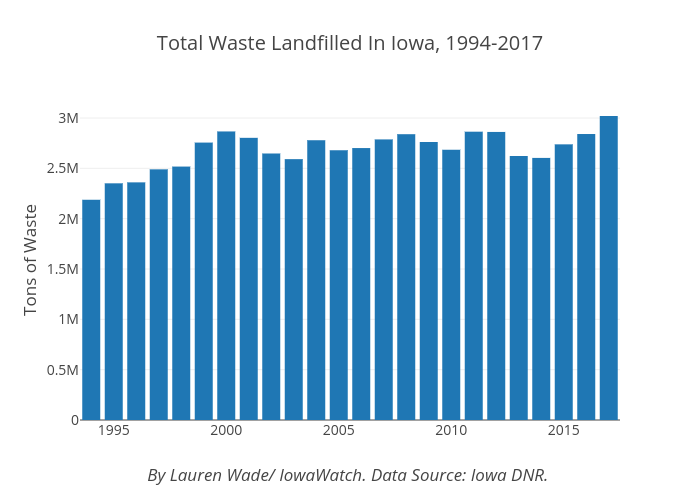
Lrmwade's interactive graph and data of "Total Waste Landfilled In Iowa, 1994-2017" is a bar chart, showing ; with By Lauren Wade/ IowaWatch. Data Source: Iowa DNR. in the x-axis and Tons of Waste in the y-axis.. The x-axis shows values from 1993.5 to 2017.5. The y-axis shows values from 0 to 3178865.252631579.