1995
2000
2005
2010
2015
0
0.5
1
1.5
2
2.5
3
3.5
4
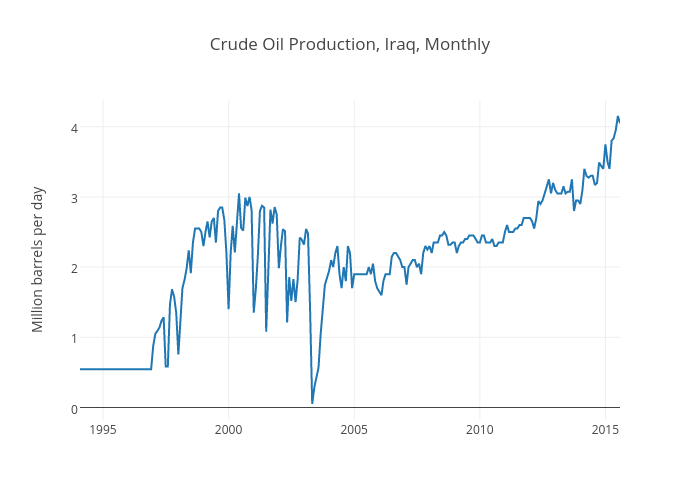
Crude Oil Production, Iraq, Monthly
Million barrels per day
plotly-logomark
Edit chart
Lrsobral's interactive graph and data of "Crude Oil Production, Iraq, Monthly" is a scatter chart, showing Value; with Million barrels per day in the y-axis. The x-axis shows values from 759981600000 to 1438311600000. The y-axis shows values from -0.17807848503433332 to 4.380951499212334.