Edit chart
Loading graph
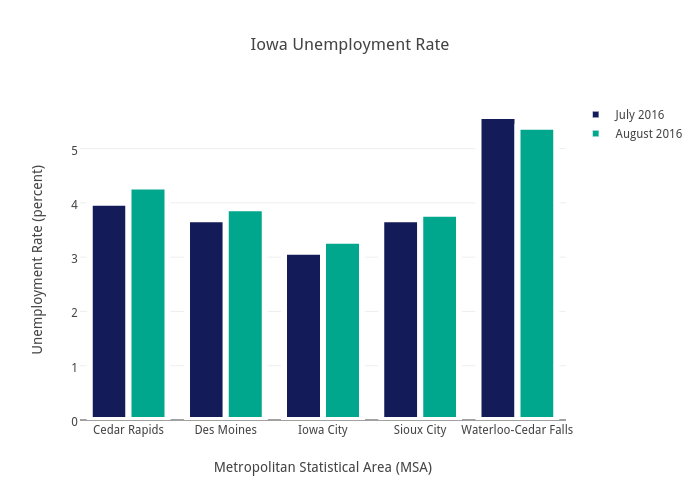
Lscarm's interactive graph and data of "Iowa Unemployment Rate" is a bar chart, showing July 2016 vs August 2016; with Metropolitan Statistical Area (MSA) in the x-axis and Unemployment Rate (percent) in the y-axis.. The x-axis shows values from -0.5 to 4.5. The y-axis shows values from 0 to 5.894736842105263.