Edit chart
Loading graph
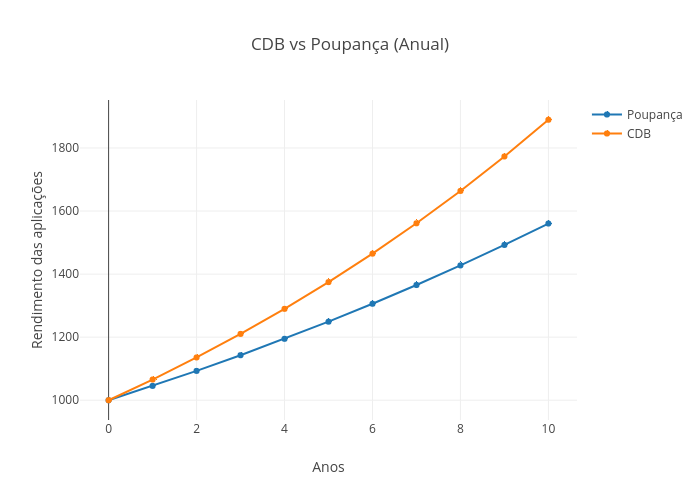
Lucasbassotto2's interactive graph and data of "CDB vs Poupança (Anual)" is a scatter chart, showing Poupança vs CDB; with Anos in the x-axis and Rendimento das aplicações in the y-axis.. The x-axis shows values from -0.5769923342079539 to 10.576992334207954. The y-axis shows values from 947.043876157739 to 1942.4661238422611.