Edit chart
Loading graph
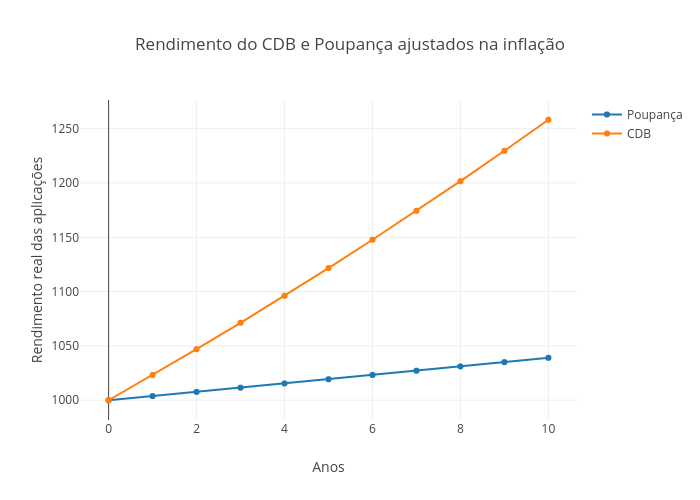
Lucasbassotto2's interactive graph and data of "Rendimento do CDB e Poupança ajustados na inflação" is a scatter chart, showing Poupança vs CDB; with Anos in the x-axis and Rendimento real das aplicações in the y-axis.. The x-axis shows values from -0.5872943327239487 to 10.587294332723948. The y-axis shows values from 984.0828454572013 to 1274.1371545427987.