Edit chart
Loading graph
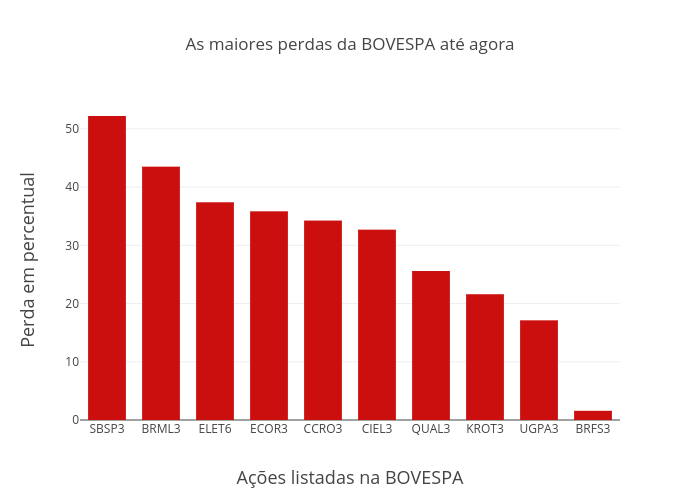
Lucasbassotto2's interactive graph and data of "As maiores perdas da BOVESPA até agora" is a bar chart; with Ações listadas na BOVESPA in the x-axis and Perda em percentual in the y-axis.. The x-axis shows values from -0.5 to 9.5. The y-axis shows values from 0 to 54.95789473684211.