Edit chart
Loading graph
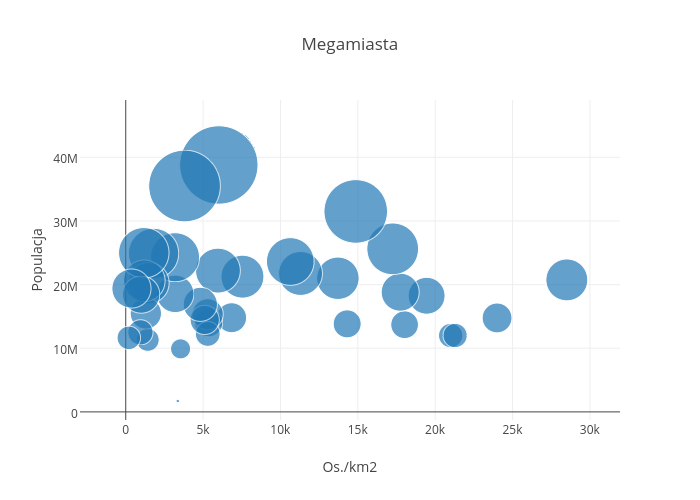
Luciamdb's interactive graph and data of "Megamiasta" is a scatter chart, showing D; with Os./km2 in the x-axis and Populacja in the y-axis.. The x-axis shows values from -1871.37098549871 to 25942.059200180567. The y-axis shows values from -987497.2263059556 to 46480044.34485905.