Edit chart
Loading graph
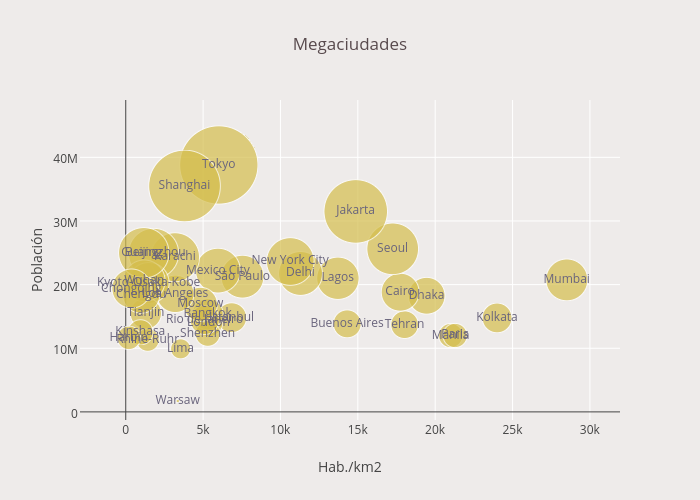
Luciamdb's interactive graph and data of "Megaciudades" is a , showing D; with Hab./km2 in the x-axis and Población in the y-axis.. The x-axis shows values from -1999.4579064799123 to 30928.07408290712. The y-axis shows values from -1102323.4700398678 to 47491445.557921484.