Edit chart
Loading graph
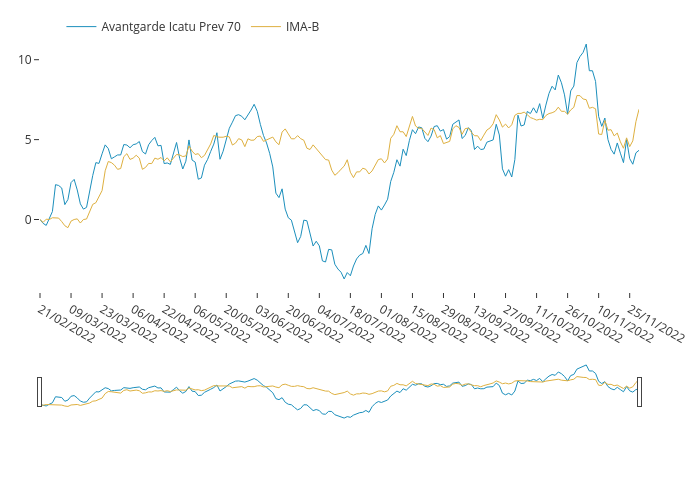
Lucianobfranca's interactive graph and data of "" is a timeseries, showing Avantgarde Icatu Prev 70 vs IMA-B. The x-axis shows values from 0 to 193. The y-axis shows values from -4.536666666666667 to 11.796666666666667.